
The Fukushima Event (Updated 04/11/2011)
The Fukushima event is slowly building to become the most significant event in the history of nuclear power. I will continue to update this page to cover all aspects of this event and also to relate this event to US reactors. Please stop back when you can.
Week of April 1
April 6 update: April 6 local and sea level links. New section on US radiation information. New references for IAEA, earthquake, dose and radiation exposure information (e.g. fallout and cancer risks).
On April 6, the leak to the sea has been stopped. At this point the event has been classified as an INES Level 5 accident. Although antinuclear proponents, e.g. Greenpeace, disagree, neither the IAEA nor the US Nuclear Regulatory Commission currently disagree with Japan's assessment.
As of April 6, radiation levels at locations around the Fukushima plant were trending downward. Sea level radiation data has also been provided. US Energy Secretary Chu estimated that 70% of the Unit 1 and 33% of the Unit 2 core had melted NY Times, April 1). The Japanese agencies have also reported concrete cracks that may provide at least one path for radioactive releases to the sea (Washington Post, April 2).
April 7 update: Added TID-1844 and NUREG-1465 links. TID-18444 was originally used for dose estimates. NUREG-1465 is now used for accident source terms in analysis of accident scenarios to determine license limitations. Also added a discussion of the SI radiation dose and radioactivity units and conversion factors.
Operators at Fukushima are adding nitrogen to prevent hydrogen explosions. Hydrogen explosions require a hydrogen-oxygen mixture of certain proportions. Use of nitrigen can reduce the presence of oxygen to minimize the possibility of an explosion. US reactors typically have hydrogen recombiners onsite to have controlled burns of hydrogen. BWR containments in the US originally used nitrogen in the containments to preclude hydrogen explosions in the event of accident.
An excellent Nuclear Crisis in Japan seminar presentation was recently provided by Dr. Alan Hanson on March 21 at the Stanford University's Freeman Spogli Institute for International Studies. It should be noted that this presentation presents an analysis based on information received to date.
Current Status
Current status of the event is provided on the following websites:
International Atomic Energy Agency - Fukushima Nuclear Accident Update Log - IAEA Top Stories and Features
Tokyo Electric Power - Updates
Japan Atomic Industrial Forum - Updates
Credible information about the Fukushima event may be obtained from the following websites.
NHK News - NHK News
Nuclear Energy Institute - Nuclear Energy Institute Background Information on Fukushima
New York Times - NY Times search - fukushima nuclear - Plant Status
Reuters - Reuters search - fukushima
Wall Street Journal - Wall Street Journal - Japan's Quake Effects from Today back to Day 1 (Graphics)
Graphics
Several news organization have produced some good graphics and videos about the event. See the following:
Washington Post Videos
Reactors
Courtesy IAEA
There are 6 reactors at the Fukushima Daiichi site: Unit 1 is a BWR-3, Units 2 through 5 are BWR-4s, and Unit 6 is a BWR-5.
BWR is the abbreviation for the Boiling Water Reactor. The BWR reactor typically allows bulk boiling of the water in the reactor. The operating temperature of the reactor is approximately 570F producing steam at a pressure of about 1000 pounds per square inch. Current BWR reactors have electrical outputs of 570 to 1300 MWe and are about 33% efficient.
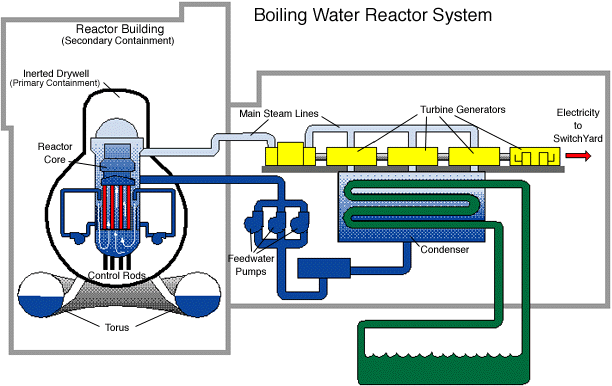
Reproduced by permission
In the figure above, water is circulated through the Reactor Core picking up heat as the water moves past the fuel assemblies. The water eventually is heated enough to convert to steam. Steam separators in the upper part of the reactor remove water from the steam.
The steam then passes through the Main Steam Lines to the Turbine-Generators. The steam typically goes first to a smaller High Pressure (HP) Turbine, then passes to Moisture Separators (not shown), then to the 2 or 3 larger Low Pressure (LP) Turbines. In the sketch above there are 3 low pressure turbines, as is common for 1000 MWe plant. The turbines are connected to each other and to the Generator by a long shaft (not one piece).
The Generator produces the electricity, typically at about 20,000 volts AC. This electrical power is then distributed to a Generator Transformer, which steps up the voltage to either 230,000 or 345,000 volts. Then the power is distributed to a switchyard or substation where the power is then sent offsite.
The steam, after passing through the turbines, then condenses in the Condenser, which is at a vacuum and is cooled by ocean, sea, lake, or river water. The condensed steam then is pumped to Low Pressure Feedwater Heaters (shown but not identified). The water then passes to the Feedwater Pumps which in turn, pump the water to the reactor and start the cycle all over again.
The BWR is unique in that the Control Rods, used to shutdown the reactor and maintain an uniform power distribution across the reactor, are inserted from the bottom by a high pressure hydraulically operated system. The BWR also has a Torus (shown above) or a Suppression Pool. The torus or suppression pool is used to remove heat released if an event occurs in which large quantities of steam are released from the reactor or the Reactor Recirculation System, used to circulate water through the reactor.
The NRC has provided a good BWR System text on their website. See the page Inside the BWR which illustrates the equipment used.
Spent Fuel Pools
The are seven spent fuel storage pools on the Fukushima Daiichi site, one in each Reactor Building and one central storage building. The pools store fuel removed from the reactor. The page http://www.nucleartourist.com/basics/sfdecay1.htm shows how radioactivity and heat released trend in the spent fuel while stored in the pools. The page http://www.nucleartourist.com/systems/spfuel1.htm shows the various forms of spent fuel storage. An IAEA presentation describes operational considerations in managing spent fuel. See Operational Safety of Spent Fuel (IAEA)
Radiation Exposure
In the US, radiation exposure due to this event should be of little concern. Radiation levels are rarely above background. Radionuclide deposition is being monitored by the Department of Energy and Environmental Protection Agencies, as well as various state agencies, e.g. Washington, Oregon, and California. Data from governmental agencies has been limited. One example of DOE data is provided in a 2010 PowerPoint presentation (Original DOE - Converted to HTML). However, the University of Washington Physics department and University of California Nuclear Engineering department have both been monitoring airborne and liquid concentrations and posting them.
The figure below shows US radiation exposure regulatory limits and typical US radiation exposures.
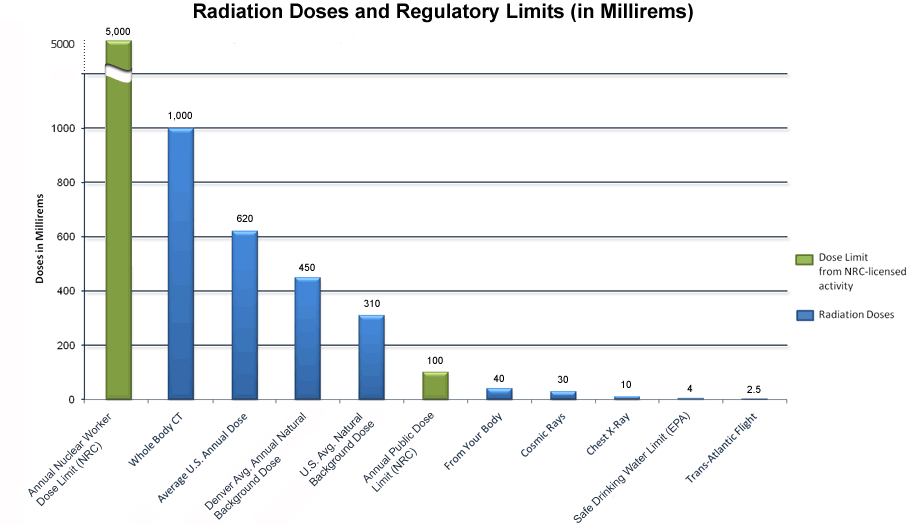
Courtesy US Nuclear Regulatory Commission
Appendix B, Annual Limits on Intake (ALIs) and Derived Air Concentrations (DACs) of Radionuclides for Occupational Exposure; Effluent Concentrations; Concentrations for Release to Sewerage, of Title 10 Code of Federal Regulations Part 20 (10CFR20), Standards for Protection against Radiation, identifies the regulatory limits for all radionuclides for workers and the public. Concentration limits in air and water for releases from nuclear power plants are presented in Table 2. As an example, click for I-131 and Cs-137 limits. To relate these limits to the data you may see in the news, 1E-10 microcuries per milliliter (mci/ml) is the same as 100 picocuries per ml (pci/ml) or 3.7 Becquerel/ml or 3.7E-3 Becquerel/m3).
Converting Units
Reporting on radiation dose, radionuclide concentrations for the Japanese reactor event has typically been expressed in the SI (metric) system of units. Units of measurement are:
The US nuclear industry typically uses the original units not SI units.
The size modifiers for each of these units are:
References
IAEA
NRC
Radiation Exposure
Chronology Of Congressional Hearings Related To Radiation And Human Research,
National Security Archive, The George Washington University, http://www.gwu.edu/~nsarchiv/ . Use search for radiation experiment
Earthquake
Earthquake Hazards Program, US Geologic Service, http://earthquake.usgs.gov/
The Pacific Northwest Seismic Network, http://www.pnsn.org/welcome.html
Copyright © 1996-2011. The Virtual Nuclear Tourist. All rights reserved. Revised: Monday April 11, 2011.